Navigating graphs efficiently
Once a diagram outgrows a single screen, the bottleneck stops being drawing and becomes moving around: find the thing, zoom in, edit it, zoom back out, find the next thing. grafli is built so that whole loop stays on the keyboard and takes a handful of keystrokes — no pan-drag-scroll-wheel dance.
This page is the tour of what's possible. For the exhaustive table see Keybindings.
The overview → focus → overview loop
The single most common rhythm is: sit in an overview, dive into one element, edit it, pop back out. That's one verb in grafli:
- Select an element (jump to it, search for it, or click it).
- gz — focus: the selection zooms up to fill the viewport, and grafli remembers where you came from.
- e — edit it inline.
- gz again — fly back to the exact overview you left.
Hop between elements without losing your way out
While focused, change the selection and press gz again — it re-focuses on the new element but keeps your original return view. A final gz always lands you back where the loop started.
Everything below is a faster way to do the "select an element" and "find your way around" parts of that loop.
Find and select an element
- Jump labels — f (or Ctrl+J) tags every visible item with a one- or two-character label; type it to select that item. This is the fastest way to put the cursor on something you can see.
- Search — / fuzzy-matches by label and dims everything else. Tab / Shift+Tab cycle the matches; Esc clears the filter.
Move through the hierarchy
When boxes are nested, walk the tree directly instead of hunting visually:
- gp — select the parent (and zoom to it if it isn't fully on screen).
- gc — select the first child.
- Tab / Shift+Tab — cycle siblings.
The status bar shows a breadcrumb of where you are, so you always know your depth.
To build that hierarchy, select one or more elements and press Ctrl+G — grafli wraps them in a new parent box sized to contain them, then opens its label editor so you can name the group. Inner nesting is preserved, and if everything you selected already shared a parent, the new box slots in beside them under it. Drag an element onto a box to nest it the other way around.
Follow the wiring
To trace how things connect rather than where they sit:
- Graph navigation — hold Alt and grafli overlays a key on each connector leaving the current node; press it to hop along that edge, chord by chord.
- Subgraph focus — B isolates the selected node and its neighbourhood (press again to cycle direction); Shift+B toggles between the full subgraph and just one hop. Great for "show me only what touches this".
Zoom and frame
- + / - — zoom in / out, anchored on your selection.
- z — step through fixed zoom levels (25 → 50 → 100 → 150 %, wraps).
- Shift+Z — zoom to fit the whole graph (your reset to overview).
- gz — focus the selection / fly back (see above).
Retrace your steps
grafli keeps a vim-style jumplist of viewports:
- Ctrl+O — jump back to the previous viewport.
- Ctrl+I — jump forward again.
Any navigation jump (a jump-label, gp, a zoom step) pushes onto this list, so you can always undo your way back through where you've looked.
Keep the big picture in view
- M — toggle the minimap: a corner overview with your viewport rectangle, so you never lose your bearings in a large graph.
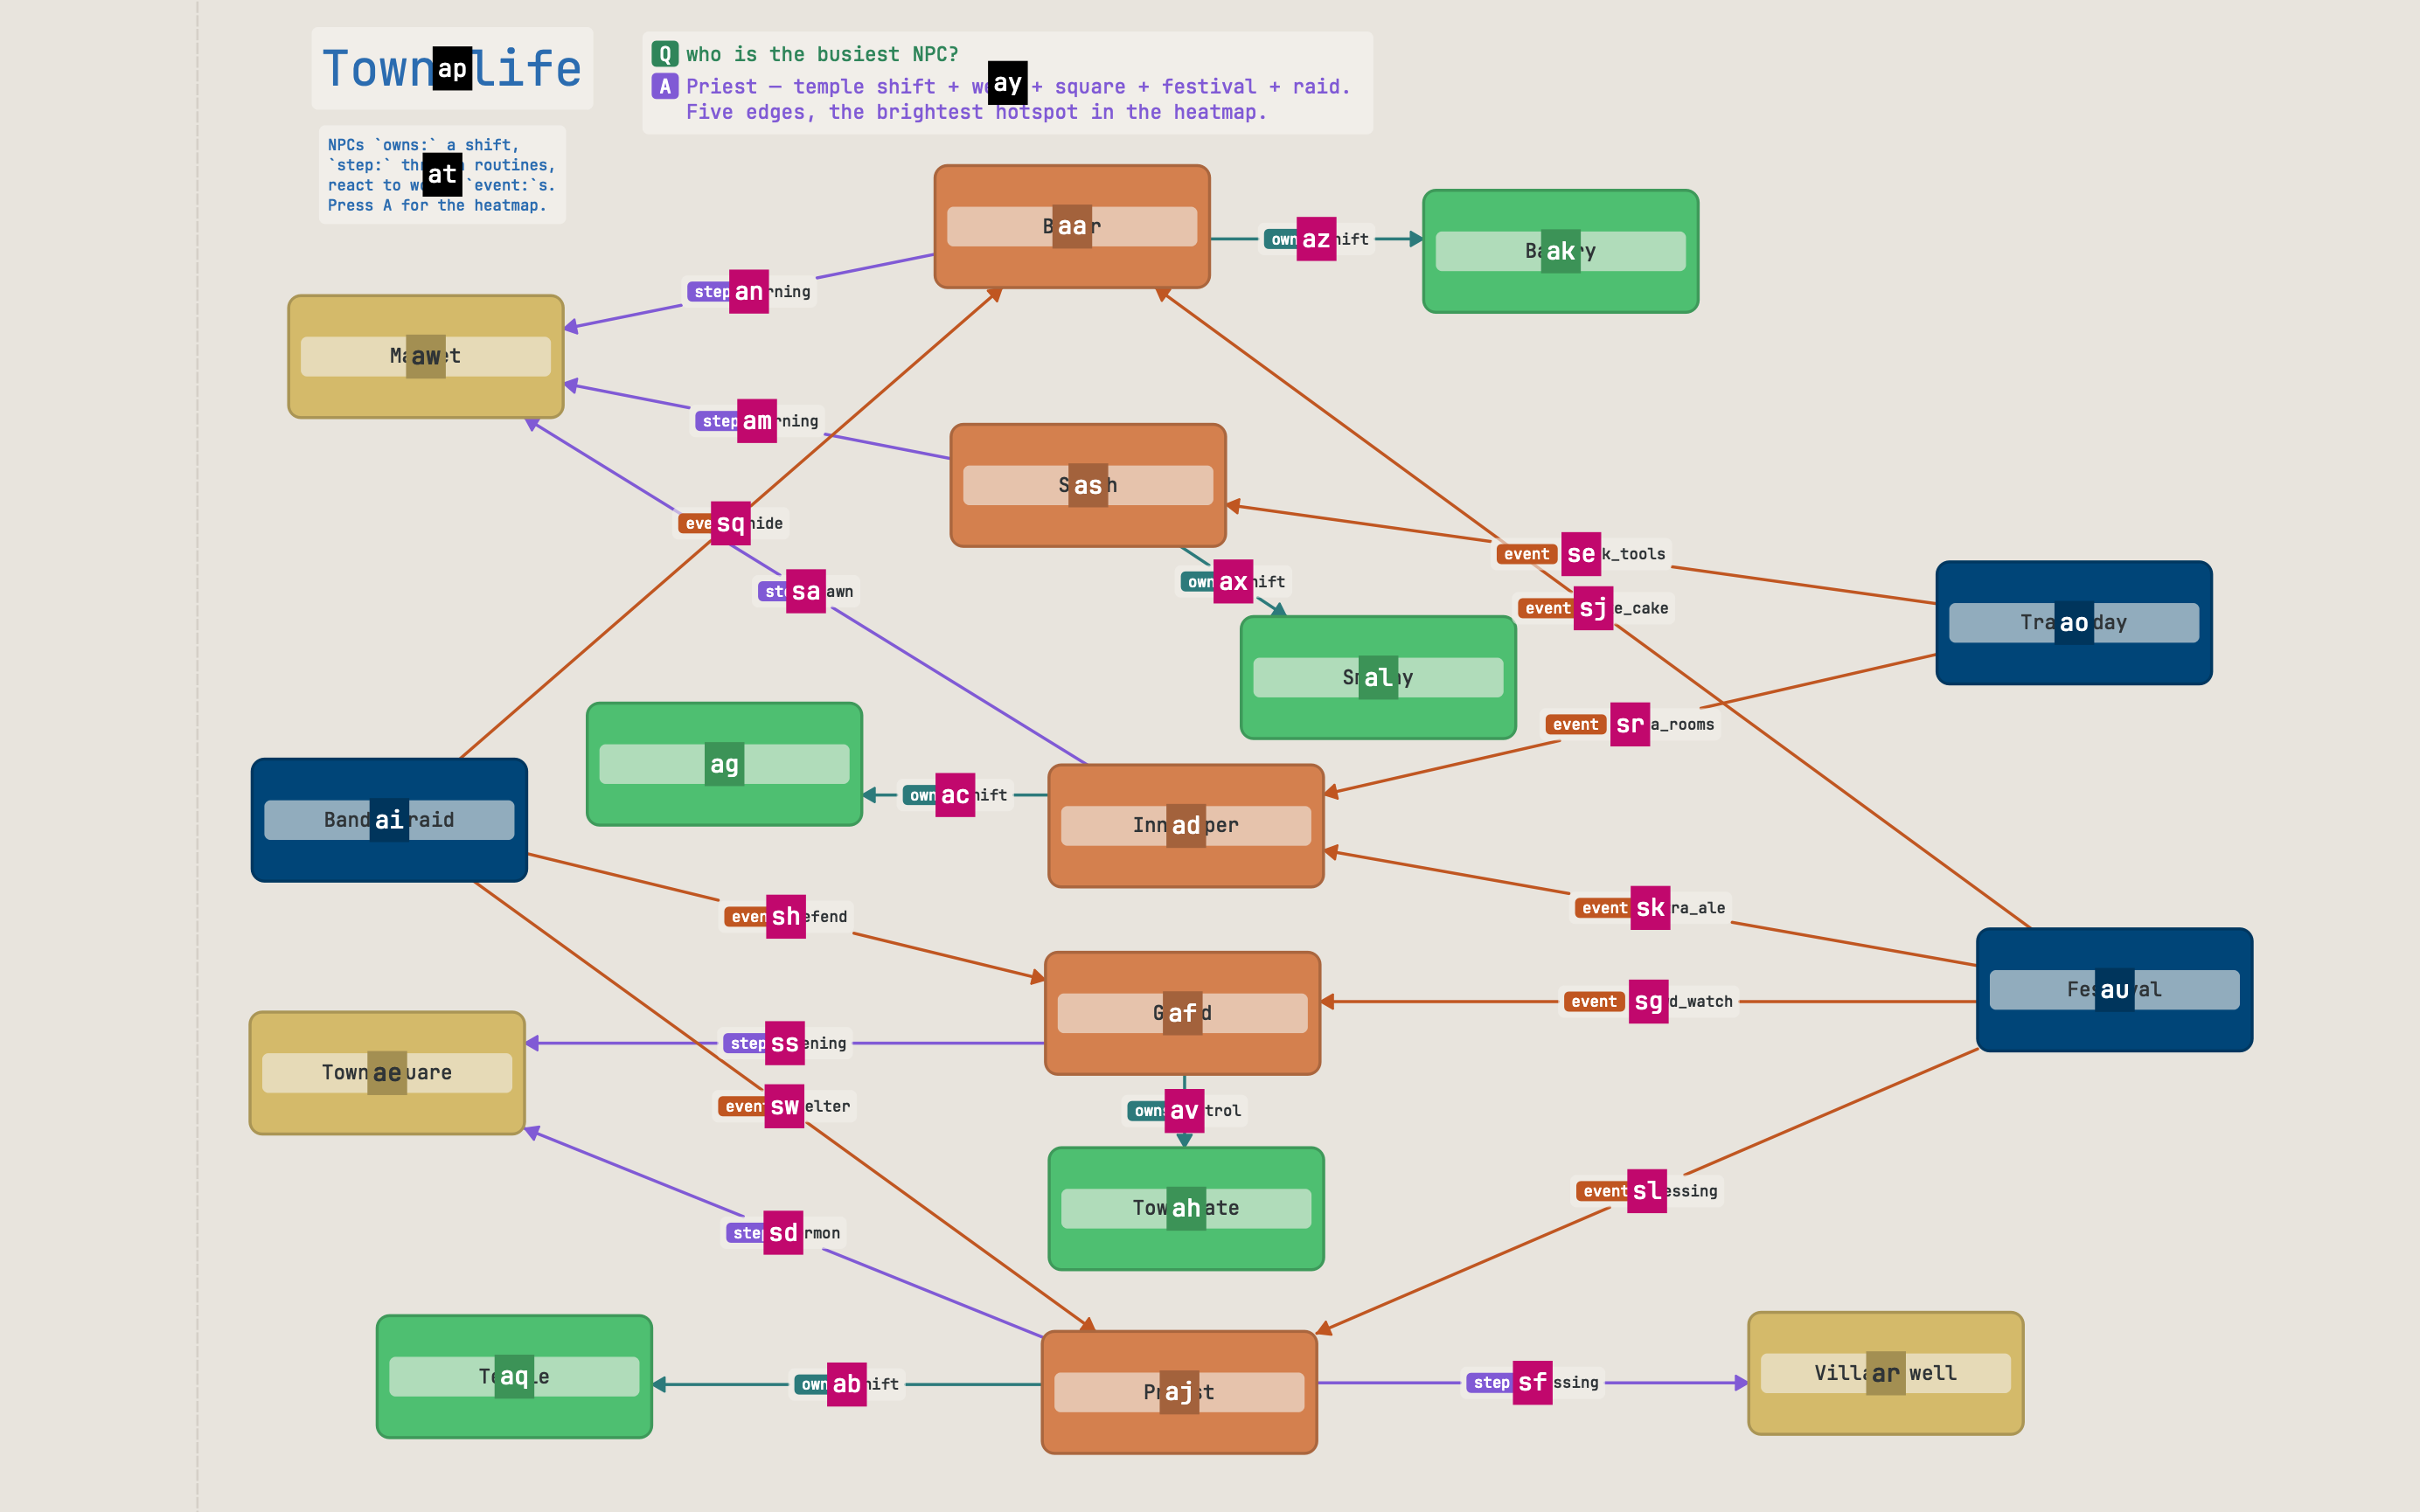
- A — complexity heatmap: colours nodes by how connected/busy they are, to spot where the density is.
Read a board zoomed out (semantic zoom)
Zooming a large board all the way out used to shrink everything into unreadable specks. Instead, grafli simplifies as you zoom out — the further you pull back, the more the canvas summarises itself, like a map that drops street names before town names before city names. It's on by default and needs no setup: just zoom out (-, z, or Shift+Z to fit the whole graph).
What happens as you pull back:
- Containers fold into tiles. A group whose children have shrunk too small to read collapses to a single tile showing its label and a child count; its contents hide and arrows re-route to the tile. Nested groups fold innermost-first, and smaller groups fold before larger ones.
- Leaves become shells. A standalone box whose label is too small keeps its colour and shows skeleton bars where the text was — you still see that there's a node here, without the unreadable label.
- Loose clusters get a hull. A connected, compact group of three or more free-floating nodes wraps in a labelled "bubble" outline (named by its busiest node), with outside arrows attaching to the boundary.
- Notes and images follow suit: a note that gets too small shows a marker so it never silently vanishes, and anything inside a folded container is subsumed into its tile.
At 100 % the board is always shown in full — aggregation is purely a zoom-out affordance — and a hysteresis band keeps the tiers from flickering as you scrub the zoom. The summary tracks your edits live: add, connect, or delete nodes and the zoomed-out view reflects it right away.
Dive into a summarised group
Aggregated tiles and hulls are read-only — you edit at full detail. Double-click a tile or hull to fly straight into that group, or just zoom back in. To switch the whole behaviour off (back to plain uniform shrinking), press Shift+D.
While summarising, the status bar shows a ◧ LoD indicator, and the minimap
(above) outlines the regions that are currently folded — so you can see at a
glance how much of the board has collapsed.
Across files
A node can link to a deeper diagram in its own .grafli file (a sub-grafli).
Click through to descend into it, edit, and come back — so a large system can
be a shallow top-level map plus focused drill-downs instead of one giant
canvas.
When you want to explain the path
Ad-hoc navigation is for working. When you want to capture a route through the graph to replay or share, use bookmarks and flows — labeled viewpoints strung into a guided tour you can step through, present, or export to PDF. See Bookmarks & flows.